New model predicts precise locations of ocean hotspots

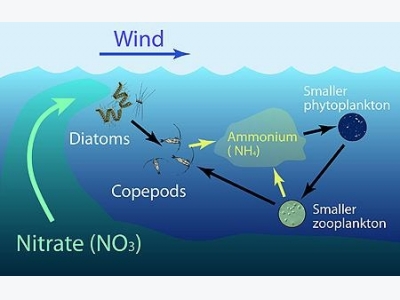
This diagram shows the key elements of Messié’s hotspot model. Wind-driven upwelling brings nitrate to the surface, where it is consumed by diatoms and other phytoplankton (microscopic algae). Diatoms are in turn consumed by copepods, which excrete ammonium. This ammonium feeds smaller phytoplankton, which are consumed by smaller zooplankton (drifting animals). During this process, wind-driven ocean currents carry both the algae and the animals away from the shore. Image: Kim Fulton-Bennett © 2017 MBARI
Each year thousands of people come to Monterey Bay to watch the feeding frenzies of seabirds, sea lions, and humpback whales. But why do certain coastal areas, such as Monterey Bay, become meccas for both humans and wildlife? A new computer model by MBARI researchers Monique Messié and Francisco Chavez can predict the locations of biological hotspots around the world, using only basic information about the local winds, currents, and concentrations of nitrate, which acts like a fertilizer for marine algae. Messié and Chavez recently published a description of their new model in the journal Geophysical Research Letters.
Monterey Bay is a hotspot for whales and other marine animals in part because of its vast swarms of anchovies and krill. Anchovies and krill are abundant because this area supports lots of smaller animals such as copepods, as well as microscopic algae such as diatoms. Diatoms grow prolifically in spring, when there is a lot of nitrate in the water. This nitrate come from deep water that is carried up toward the surface when strong northwest winds push surface water away from shore—a process known as upwelling.
Even though upwelling events typically last just a few days, their biological impacts can continue for weeks or months, as diatom blooms allow zooplankton such as copepods and krill to feed, grow, and reproduce. During this time, ocean currents can carry both the diatoms and the zooplankton dozens of kilometers away from the coast.
So the short answer about Monterey Bay is that it is a hotspot because of upwelling. This much can be predicted using existing models. But Messié’s model is unusual because it shows in great detail where animals (in this case, copepods) are likely to congregate in and around upwelling areas.

The model is designed to predict the geographic distribution of copepods such as this one, which was collected near Monterey Bay. Image Julio Harvey © 2010 MBARI
Using a computer model to reproduce this process is a huge challenge. Most computer models of the ocean are extremely complex, incorporating many different factors about physical and sometimes biological processes that occur at various depths.
In contrast, Messié’s new model is relatively simple. Yet it does a surprisingly good job at predicting the detailed locations of known hotspots around several of the world’s most important upwelling areas.
At the core of the model is nitrate, an essential nutrient for diatoms and many other microscopic marine algae (also known as phytoplankton). Many phytoplankton need nitrate to grow. But diatoms proliferate only when there is a lot of nitrate in the sunlit surface waters.
Lacking detailed data on nitrate concentrations at remote upwelling centers, Messié and her colleagues used generalized information about the amount of available in deep water in the various upwelling areas, combined with information about the local winds that bring this nitrate up toward the surface.
The model also takes into consideration ocean currents. “One of the things we learned in creating this model,” Messié noted, “was how important ocean currents were in moving nitrate and algae within the ocean. At first we tried to do our own calculations of currents from generalized information about winds, but we eventually used an existing data repository that provided estimates of ocean currents based on satellite data.”

These maps show the model’s estimated densities of copepods during upwelling season off the coasts of California and Peru. The dotted lines show upwelling-related currents carrying copepods away from shore. The red dots indicate where the model predicted the densest populations of copepods. The numbers along the coast indicate previously known biological hotspots. Image: Monique Messié © 2017 MBARI
The researchers first checked the model’s results against field data collected off the coast of Central California by MBARI, the National Oceanic and Atmospheric Administration (NOAA), and the California Cooperative Oceanic Fisheries Investigations (CalCOFI).
According to Messié, “The model did a good job simulating overall patterns of phytoplankton succession, and differences between onshore and offshore populations.” For example, the model predicted peak concentrations of copepods about 50 to 100 kilometers away from the coast–a phenomenon that was observed by CalCOFI zooplankton surveys in the region.
The copepod hotspots predicted by the model also matched krill hotspots identified during NOAA’s field surveys. Krill tend to live in deeper water than copepods, where they might not be as affected by surface currents. For this reason, the researchers were initially surprised that krill would end up in the areas predicted as hotspots for copepods. But the finding makes sense when you consider that biological hotspots often host many different types of animals (seabirds, sea lions, and humpbacks, for example).
Messié notes that, as long as they can accurately simulate real-world conditions, smaller, simpler models have several advantages over larger models. For one thing, they take much less computer time to run (some large models take days or weeks to run, even on supercomputers). Smaller models can be run more or less in real time to study existing conditions and events while they are still occurring. They are also relatively easy to modify to test competing scientific hypotheses.
On the downside, Messié’s current model is only designed to simulate conditions over an entire upwelling season (spring and summer in Central California). In addition, it cannot identify hotspots that form because of nitrate sources other than local upwelling. (The Gulf of the Farallones, just offshore of San Francisco Bay, might be such a place).
Messié, Chavez, and several collaborators at the University of California, Santa Cruz, recently received a $700,000, three-year grant from NASA to extend the existing model so that it can track or predict the evolution of hotspots on a month-by-month basis.
They also hope to find out how well their modeled zooplankton hotspots match with known hotspots for whales and seabirds. If the answer is “very well” then the model might be used to predict where whales and seabirds aggregate at different times of year. This could help scientists studying the animals and conservation groups hoping to protect them, not to mention members of the public who want to know the best times and places for wildlife viewing.
Messié and Chavez’s recent paper shows that, even in computer models, small can sometimes be beautiful!
Có thể bạn quan tâm
Phần mềm

Phối trộn thức ăn chăn nuôi

Pha dung dịch thủy canh

Định mức cho tôm ăn

Phối trộn phân bón NPK

Xác định tỷ lệ tôm sống

Chuyển đổi đơn vị phân bón

Xác định công suất sục khí

Chuyển đổi đơn vị tôm

Tính diện tích nhà kính

Tính thể tích ao hồ


 Fishing quotas to be set at local level
  How to tap domestic seafood market potential